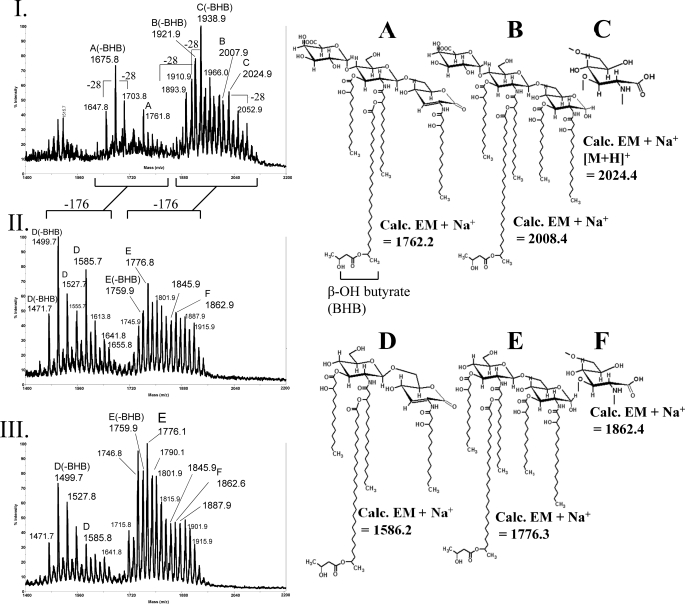
FIGURE 5.
MALDI-TOF MS analysis of the rgtD− and rgtE− lipid A. Spectra were acquired in the positive reflectron mode. I, parent strain 3841 is shown. II, mutant strain EL202 (rgtE−) is shown. III, mutant strain EL206 (rgtD−) is shown. Structures A–F indicates ions observed in the spectra, and the calculated exact masses (Calc. EM) are labeled. Variations occur to structures A–F by the presence or absence of β-hydroxybutyryl (BHB; −86) and variation in the chain length of the hydroxy fatty acids (±28 and/or 14). Panels II and III contain ions with masses consistent with the absence of GalA (−176 mass units).

