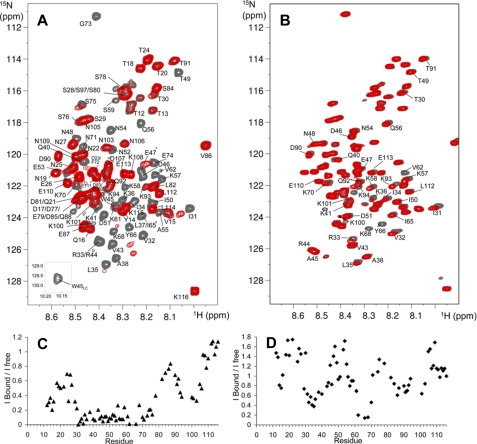
FIGURE 4.
NMR mapping of the PfI3 sites interacting with PfPP1. A, overlaid {1H-15N} HSQC of 15N-PfI3, free (gray spectrum), and in presence of an equimolar amount of PfPP1 (superimposed red spectrum). Interaction induces broadening of numerous resonances; see for example the isolated Gly73 resonance, in the upper part of the spectrum. The amide side chain resonance of Trp45 is shown as an inset. B, same color code is applied for the overlaid spectra corresponding to 15N-PfI3W45A free or in presence of PfPP1. Resonances of PfI3 are all annotated (A), although the annotated resonances of 15N-PfI3W45A are restricted to those showing perturbation upon PfPP1 addition or located around Ala45 (B). The supplemental Fig. S2 provides a comparison of the (1H-15N} HSQC of 15N-PfI3 and 15N-PfI3W45A. The graphics below the spectra show the normalized ratio of the intensity of a given resonance in the free PfI3 and in the 1:1 PfI3:PfPP1 spectra (C) or free PfI3W45A and in the 1:1 PfI3W45A:PfPP1 spectra (D), reported along the PfI3 sequence.

