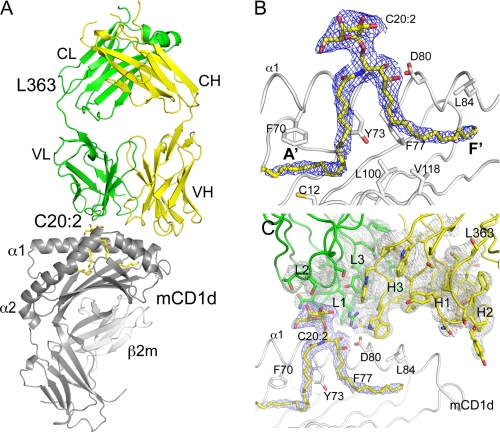
FIGURE 2.
Structure of the L363-C20:2-αGalCer-mCD1d complex. A, overall structure of the ternary complex illustrates the TCR-like docking mode above the α1 and α2 helixes of mCD1d. L363 light chain (VL and CL) is shown in green, and heavy chain (VH and CH) is shown in yellow; C20:2-αGalCer is shown as yellow sticks; mCD1d heavy chain and β2m are in gray. B, final 2Fo − Fc electron density map for the glycolipid C20:2-αGalCer in a side (left panel) and top view (right panel). C, stereo view of electron density around CDR loops (L1–3 and H1–3). The 2Fo − Fc map is contoured at 1 σ and shown as blue mesh for C20:2-αGalCer and gray mesh for L363. Several mCD1d residues interacting with the glycolipid are depicted.

