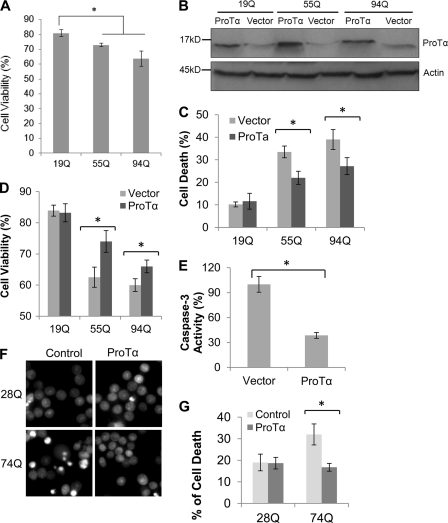
FIGURE 4.
Overexpression of ProTα suppresses mHtt-caused cell death and caspase-3 activation. A, graph showing percentage of cell viability after the HEK293 cells stably expressing Htt19Q, 55Q, or 94Q were exposed to 200 μm H2O2 in serum-free medium for 2 days. Percentage of cell viability was calculated by determining the ratio of Trypan blue-negatively stained cells to the total cells. Data are shown as mean ± S.D.; n = 3; asterisk, p < 0.01. B, Western blot showing the expression of the three HEK293 cell lines transfected with either an expression vector expressing ProTα or with an empty vector (Vector). An equal amount of protein from each cell line was loaded on the gel. Actin is shown as a loading control. C and D, cells stably expressing SF-tagged 19Q, 55Q, or 94Q were transfected either with an empty control vector or a ProTα expression vector and then grown in serum-free medium supplemented with 200 μm H2O2 to facilitate cell death. After 48 h, cell death was analyzed by the Trypan blue exclusion method (C) and cell viability was determined by an MTT assay (D). Data are shown as mean ± S.D.; in C, a total of over 105 cells were counted; n = 4 in C; n = 3 in D; asterisk, p < 0.05. E, overexpression of ProTα inhibits caspase-3 activity. Cells expressing SF-Htt94Q were transfected with either an empty (Vector) or ProTα expression vector. Thirty-six hours after transfection, the cell growth medium was replaced with a serum-free medium supplemented with 200 μm H2O2, and cell culture was continued for 12 h before the cell lysates were collected for a caspase-3 activity assay. Data are shown as mean ± S.D.; n = 3; asterisk, p < 0.05. F, overexpression of ProTα inhibits mHtt-induced cell death in neuronal cell lines stably expressing Htt. The inducible neuronal cell lines stably expressing GFP-tagged Htt exon 1 fusion protein containing either 28Q or 74Q were then transfected with either an empty control vector (Control) or a ProTα expression vector and then grown in a neuronal differentiation medium for 3 days. The cells were then treated with 50 μm H2O2 for 20 h, and cell death was analyzed by staining the nuclei with Hoechst 33342. Cells with condensed/fragmented nuclei, indicative of dying cells, show bright fluorescence. G, graph showing quantification of fragmented/condensed nuclei in the experiments described in F. Data are shown as mean ± S.D.; n = 3; asterisk, p < 0.001.

