FIGURE 7.
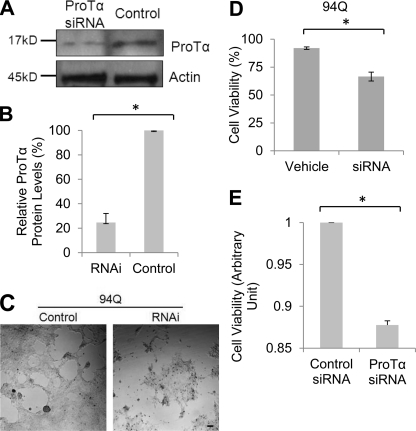
Down-regulation of ProTα enhances mHtt-caused cell death. A, Western blots showing successful knockdown of ProTα protein expression by synthetic siRNAs. Cells expressing SF-Htt94Q were transfected with control or ProTα siRNAs. Cells were harvested 2 days after the transfection and equal amounts of protein were immunoblotted for ProTα. B, graph showing quantification of band intensity shown in A. Data are shown as mean ± S.D.; n = 3; asterisk, p < 0.0001. C, representative images showing that knockdown of ProTα is associated with increased cell death in SF-Htt94Q-expressing cells. SF-Htt94Q-expressing cells that were plated in 12-well plates at an equivalent density were transfected with either control or ProTα siRNAs. The phase contrast images shown were taken 2 days after siRNA transfection. D, graph showing quantification of cell death analyzed by the Trypan blue exclusion method in the SF-Htt94Q-expressing cells with ProTα knockdown. Over 1,000 cells were counted in each experiment. Data are shown as mean ± S.D.; n = 4; asterisk, p < 0.05. E, MTT assay results showing cell viability in the neuronal cells expressing GFP-tagged Htt74Q cells after down-regulation of ProTα expression. Data are shown as mean ± S.D.; asterisk, n = 3; p < 0.0001.

