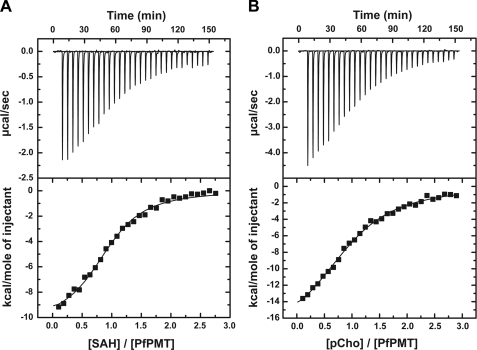
FIGURE 6.
ITC analysis of ligand binding. A, titration of PfPMT with AdoCys. The top panel shows data plotted as heat signal (μcal sec−1) versus time (min). The experiment consisted of 30 injections of 10 μl AdoCys (650 μm) into a solution containing PMT protein (51.5 μm) at 20 °C. The bottom panel shows the integrated heat response per injection from the upper panel plotted as normalized heat per mol of injectant. SAH, S-adenosylhomocysteine. The solid line represents the fit to the data. B, titration of PfPMT (65.1 μm) with pCho (850 μm). Top and bottom panels are as in A.

