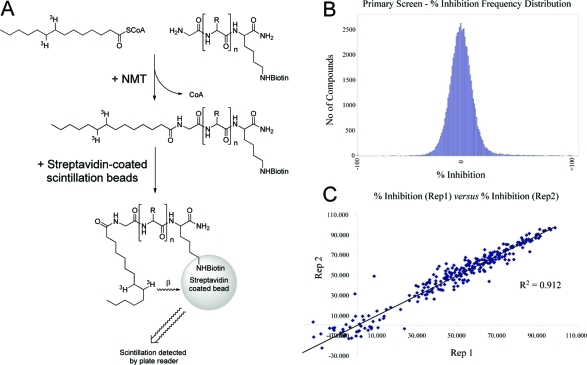
Figure 1.
Format and performance of the HTS assay: (A) % inhibition and IC50 values determined using a scintillation proximity assay;2(B) frequency histogram representing % inhibition values for the HTS. Hits are designated as those compounds that displayed a % inhibition equal to or greater than 3 standard deviation units above the mean (40% inhibition). (C) Comparison of replicate % inhibition values for the 352 primary screen hits.

