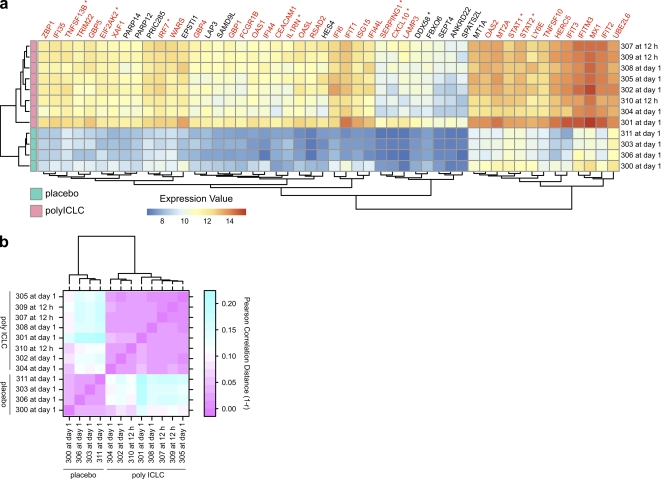
Figure 2.
Poly ICLC reliably induces IFN signaling in healthy volunteers. (a) Heat map representation of the normalized expression values. Genes shown are the top 50 differentially expressed at day 1 (FC > 2 at 5% FDR), the group-level peak time point (poly ICLC n = 8 or placebo n = 4). Each volunteer who received poly ICLC (horizontal rows) is represented at the volunteer-specific peak time (right labels), as in Fig. S2. IRGs are highlighted in red. *, genes discussed in the text. (b) Heat map representation of the between-subject correlation of the expression values for IRGs at subject-specific peak times after poly ICLC administration. The color gradient extends from pink, representing perfect correlation (or a correlation distance r of 0, i.e., 1 − r = 0), to cyan for low correlation.

