Figure 4.
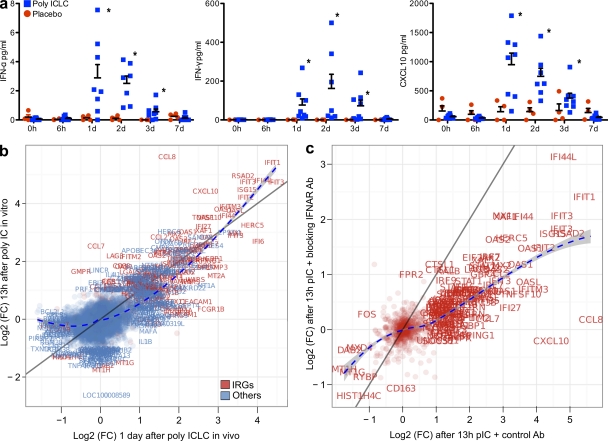
Validation of the transcriptional profiling on PBMCs. (a) Poly ICLC induced systemic secretion of IFNs. Plasma concentrations of IFN-γ, IFN-α, and CXCL10 at time points after poly ICLC (blue, n = 8) or placebo (red, n = 4) were analyzed by two-way ANOVA. Error bars represent the standard error of the mean concentrations. Poly ICLC effects were significant at days 1–3 (*, P < 0.001). (b and c) PBMCs from four donors were stimulated with 50 µg/ml poly IC for 13 h plus 10 µg/ml IFNAR antibody or isotype control antibody. RNA was extracted for transcriptional analysis. (b) Differential gene expression in blood 1 d after in vivo poly ICLC (x axis, n = 8) was compared with differential gene expression in PBMCs after 13 h of poly IC stimulation in vitro (y axis, n = 4). Genes falling on the identity line (dark gray) are equally regulated in both systems. A loss curve (dashed blue) is used to infer the local trend between the two systems. IRGs are in red. Text labels are added to points for genes with FC > 2 at 5% FDR in at least one comparison. (c) Log2(FC) of IRGs after in vitro poly IC with blocking anti-IFNAR mAb (y axis) and after in vitro poly IC with control antibody (x axis).

