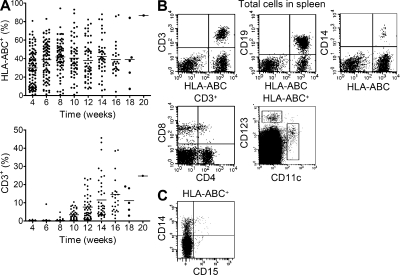
Figure 2.
Human hematopoietic cell engraftment and immune cell development in humanized mice. (A) Data represent the percentage of human HLA-ABC+ or CD3+ cells in the peripheral blood of consecutively analyzed mice at the indicated weeks after transplantation of human CD34+ cells. Cumulative data (n = 111) were obtained from >10 independent experiments. Horizontal bars indicate the mean. (B) Flow cytometry data show CD4+CD3+ or CD8+CD3+ T cells, B cells (CD19+), monocytes (CD14+), and conventional (CD11c+) or plasmacytoid (CD123+) DCs in the spleen. Data shown are representative of more than five independent experiments. (C) Flow cytometry data show the individual population of CD14+CD15− monocytes and CD14−CD15+ neutrophils in the peripheral blood. Shown are representative data from one experiment of two mice.

