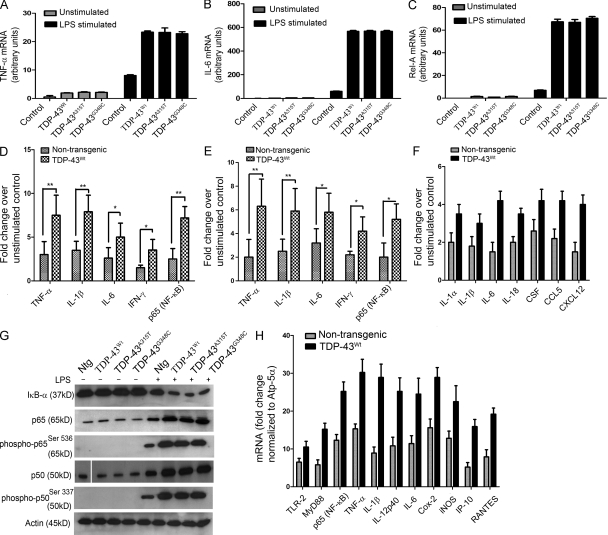
Figure 7.
Analysis of genes involved in inflammation of mouse microglial and macrophage cells overexpressing human TDP-43. (A–C) Mouse microglial cells BV-2 were either transfected with pCMV–TDP-43WT, pCMV–TDP-43A315T, and pCMV–TDP-43G348C or with empty vectors for 48 h. These cells were then either stimulated with LPS at a concentration of 100 ng/ml or unstimulated (as indicated). 12 h after stimulation, total RNA was extracted with TRIZOL. The total RNA samples were then subjected to real-time quantitative RT-PCR for TNF (A), IL-6 (B), and Rel-A (p65; C). Error bars represent mean ± SEM from five different experiments. (D) Primary microglial cultures from TDP-43WT and B6 nontransgenic mice were stimulated with 100 ng/ml LPS. Proteins from LPS-stimulated microglial cultures were subjected to multianalyte ELISA for inflammatory cytokines and p65. Error bars represent mean ± SEM from four different experiments. (E) Primary microglial cultures from TDP-43WT and B6 nontransgenic mice were treated with 1 mM H2O2 for 1 h and incubated in serum-free media for 12 h to study the effect of ROS. (F) Pure (>90%) primary astrocytes from TDP-43WT and B6 nontransgenic mice were stimulated with LPS and their response studied using real-time PCR for various genes as indicated. (E and F) Error bars represent mean ± SEM from three different experiments. (G) Primary microglial cells from TDP-43WT, TDP-43A315T, TDP-43G348C, and B6 nontransgenic mice (Ntg) were stimulated or unstimulated with LPS. Immunoblots were run to determine the levels of various proteins using specific antibodies as indicated. A representative blot from two independent experiments is shown. (H) BMMs isolated from TDP-43WT and B6 nontransgenic mice were stimulated with 100 ng/ml LPS for 12 h. Total RNA samples were then subjected to real-time quantitative RT-PCR for various genes as indicated. Results are displayed as fold change over unstimulated control. All real-time RT-PCR values are normalized to Atp-5α levels. Error bars represent mean ± SEM from four different experiments. (A–F and H) Statistical analysis was performed by two-way ANOVA with Bonferroni adjustment (*, P < 0.05; **, P < 0.01).

