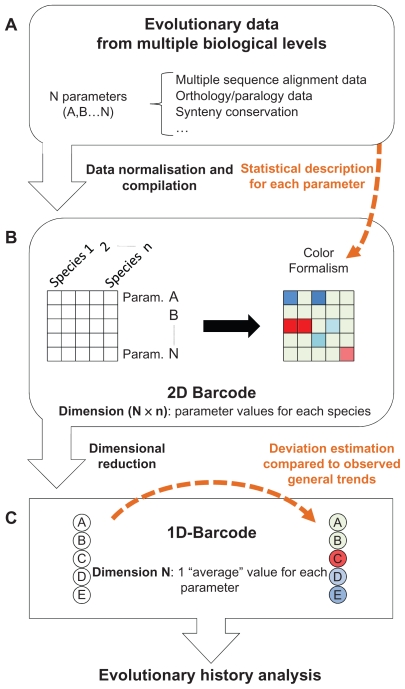
Figure 1.
Schematic view of the methodology used to produce the barcodes representing the evolutionary histories of the human proteome. Three main steps are shown. (A) Multiple evolutionary parameters are selected and described statistically. (B) The values of these parameters for different species are compiled in a 2D barcode. The statistical description of these parameters is used to define a colour code for the barcode. (C) For each barcode, a lower dimensional barcode (1D- barcode) is generated.

