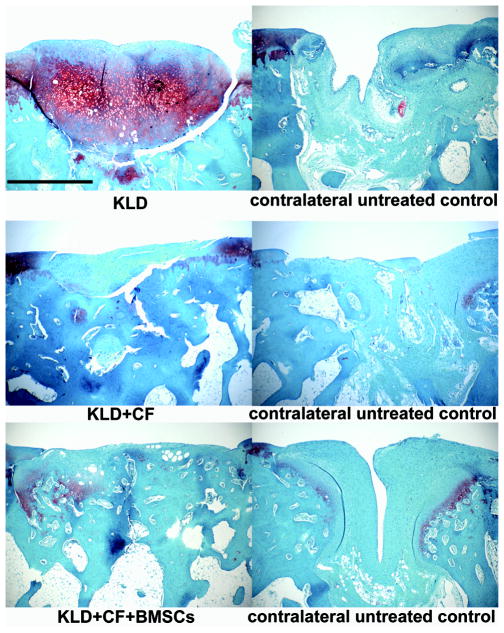
Fig 2.
Safranin-O staining. Images showing histological evaluation of representative treatment groups and representative contralateral control knees. Treatment and contralateral pictures were representative of the mean scores and were taken from different animals for KLD and KLD+CF+BMSCs, and from the same animal for KLD+CF. Scale bar = 1 mm.

