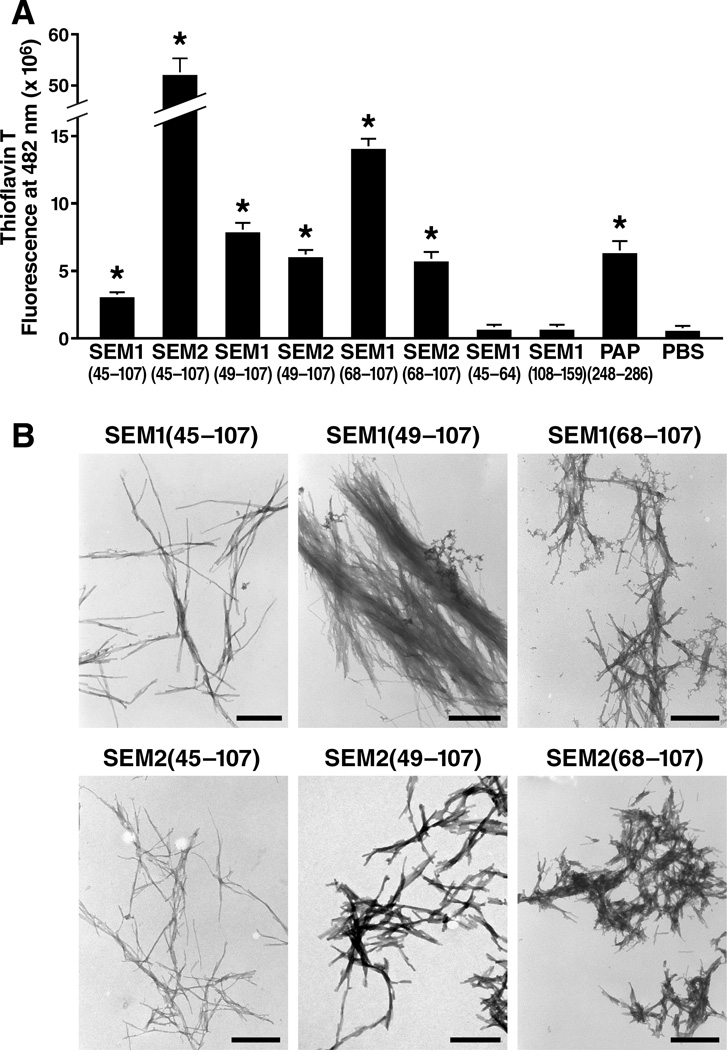
Figure 2. Peptides from SEM1 and SEM2 Form Amyloid Fibrils.
(A) The indicated agitated peptides were mixed with 5 µM Thioflavin T and the emissions at 482 nm were recorded. PAP248–286 is an amyloidogenic peptide that polymerizes into SEVI (Munch et al., 2007). *P < 0.0005 vs. PBS control (two-tailed t test). Shown are average values (± standard deviations) of triplicate well measurements from one of seven independent experiments that yielded similar results. See Table S2 for peptide sequences.
(B) Electron micrographs of the fibrillar SEM peptides. Scale bars indicate 500 nm. Shown are results from one of two independent experiments that yielded similar results.

