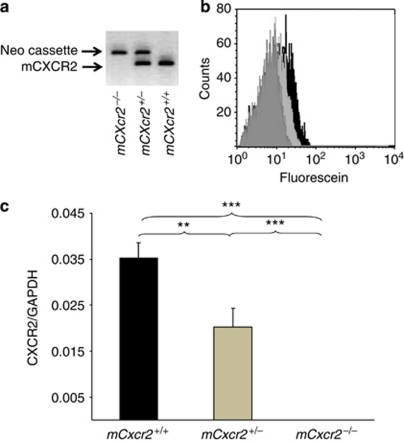
Figure 1.
mCxcr2 genotyping and mCxcr2 expression of mCxcr2+/+, mCxcr2+/−, and mCxcr2−/− mice. (a) mCxcr2 genotype as determined by PCR using primers specific for mCXCR2 for the neomycin gene. (b) Neutrophil mCXCR2 surface expression in mCxcr2+/+, mCxcr2+/−, and mCxcr2−/− mice, quantified by flow cytometry. mCxcr2−/− mice (light gray) had no receptor expression, as verified by comparison with the IgG isotype control, mCxcr2+/− ( dark gray) and mCxcr2+/+ (black). (c) Relative mCXCR2 mRNA expression (compared with glyceraldehydes-3-phosphate dehydrogenase (GAPDH)). Results are means±s.e.m. (**P<0.01, ***P⩽0.001). Representative data are shown from five separate experiments.

