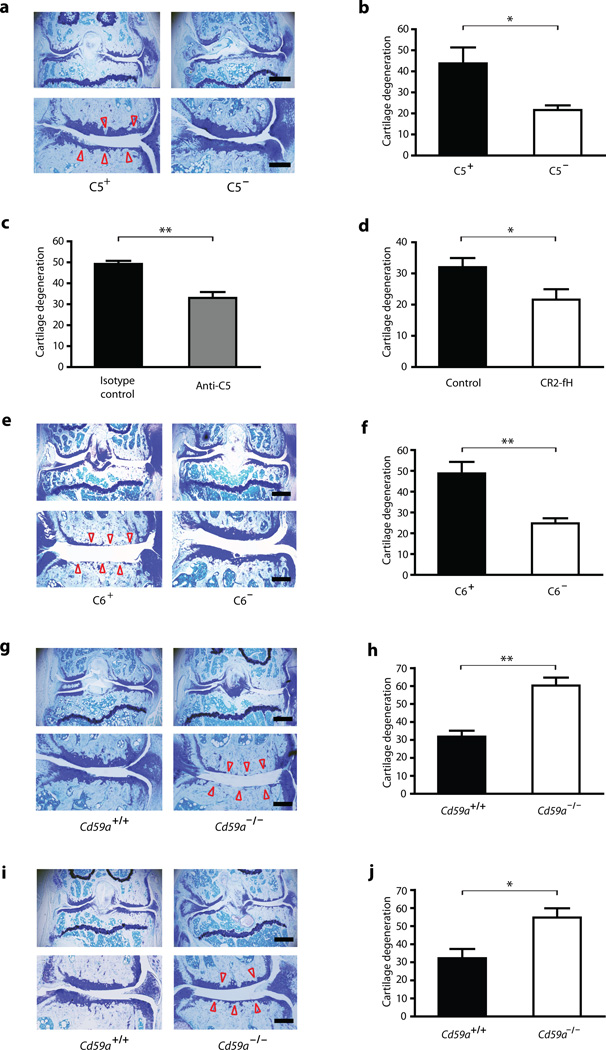
Figure 2.
The complement cascade, acting through its MAC effector arm, is crucial for the development of osteoarthritis in three different mouse models. (a,e,g,i) Toluidine-blue-stained sections of the medial region of mouse stifle joints. (a) Representative cartilage degeneration in C5+ and C5− mice subjected to medial meniscectomy. (b) Quantification of cartilage degeneration in (a) (n = 5 mice per group). (c) Quantification of cartilage degeneration in wild-type mice subjected to medial meniscectomy and then treated i.p. with 750 µg of either the C5-specific monoclonal antibody BB5.1 or an isotype-control antibody (n = 5 mice per group). (d) Quantification of cartilage degeneration in wild-type mice subjected to medial meniscectomy and then treated i.v. with 250 µg of CR2-fH or with PBS (n = 5 mice per group). (e) Representative cartilage degeneration in C6+ and C6− mice subjected to medial meniscectomy. (f) Quantification of cartilage degeneration in (e) (n = 13 mice per group). (g) Representative cartilage degeneration in Cd59a+/+ and Cd59a−/− mice subjected to medial meniscectomy. (h) Quantification of cartilage degeneration in (g) (n = 10 mice per group). (i) Representative cartilage degeneration in Cd59a+/+ and Cd59a−/− mice subjected to DMM. (j) Quantification of cartilage degeneration in (i) (n = 5 mice per group). Arrowheads indicate areas of cartilage degeneration. Scale bars: low-magnification (uppermost) images, 500 µm; higher-magnification (lower) images, 200 µm. Bar-chart data are the mean + s.e.m. *P < 0.05, **P < 0.01, by t test.

