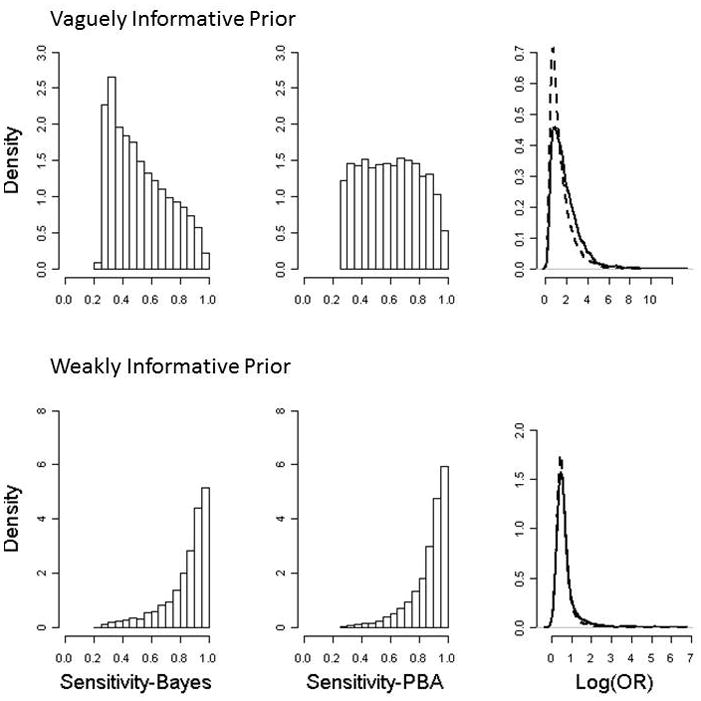
Figure 2.

Posterior distribution of sensitivity and log(OR) under the Bayesian and probabilistic bias analysis approaches. First row results from a vaguely informative prior on sensitivity while the second row results from a weakly informative prior. Dashed lines are the density estimates for the probabilistic bias analysis approach and solid lines are for the Bayesian approach.
