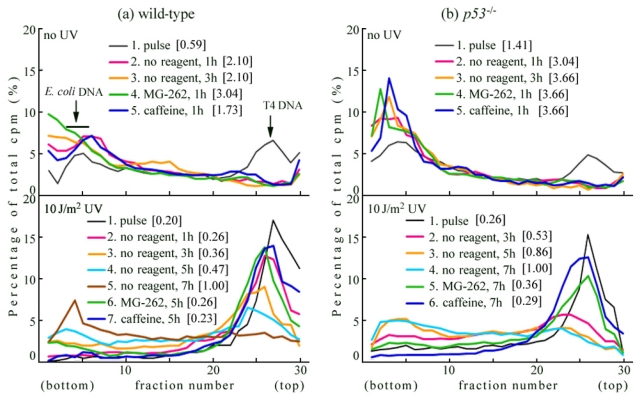
Figure 1.
Alkaline sucrose density gradient centrifugation (ASDG) profiles of replication products in (a) wild-type and (b) p53−/− mouse embryo fibroblasts (MEFs). (Time course and effects of MG-262 or caffeine); (upper panel) Non-irradiated cells were pulse-labeled with 10 μCi/mL of [14C]-thymidine for 30 min, and chased in normal medium for 1 h or 3 h. Similarly, pulse-labeled cells were chased for 1 h in normal medium containing 5.0 μM MG-262 or 5 mM caffeine; (lower panel) Cells were irradiated with 10 J/m2 UV and incubated for 30 min. The cells were then pulse-labeled with 10 μCi/mL of [14C]-thymidine for 1 h, and chased in normal medium for 1 h, 3 h, 5 h, or 7 h. Similarly, pulse-labeled cells were chased for 5 h or 7 h in normal medium containing 5.0 μM MG-262 or 5 mM caffeine, respectively. Sedimentation is from right to left. The arrow indicates the position of T4 phage DNA (166 kb, i.e., approximately 5.5 × 10⁷ Da/single strand). Labeled E. coli DNA (approximately 4 Mb) sedimented near the bottom (fractions 3–6) [28]. The average fragment length (in Mb) of each profile is shown in square brackets. cpm: counts per minute.

