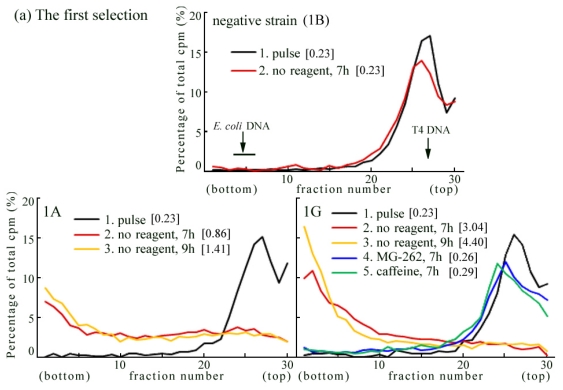
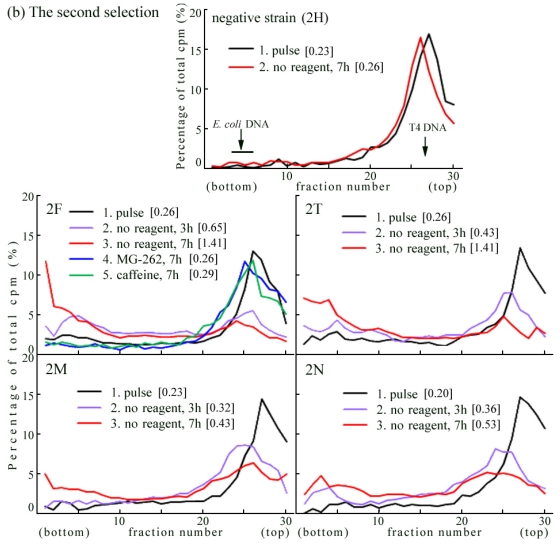
Figure 4.
Introduction of the mouse Rev3 expression vector into Rev3−/−-1 MEFs. (a) the first selection and (b) the second selection. (Time course and effects of MG-262 or caffeine by ASDG) The vector containing mouse Rev3 cDNA was introduced into Rev3−/−-1 cells. In the first selection, the blasticidine S-resistant cell lines were picked up, and their UV-TLS responses were observed by ASDG. In the second selection, the plasmid was linearized by FspI digestion and transfected into Rev3−/−-1 cells. Sedimentation is from right to left. The arrow indicates the position of T4 phage DNA (166 kb, i.e., approximately 5.5 × 10⁷ Da/single strand). Labeled E. coli DNA (approximately 4 Mb) sedimented near the bottom (fractions 3–6) [28]. The average fragment length (in Mb) of each profile is shown in square brackets. cpm: counts per minute.


