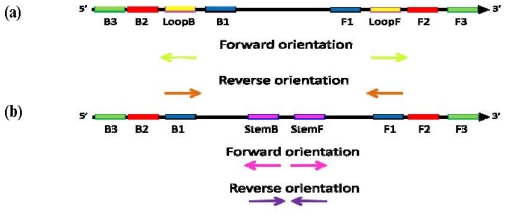
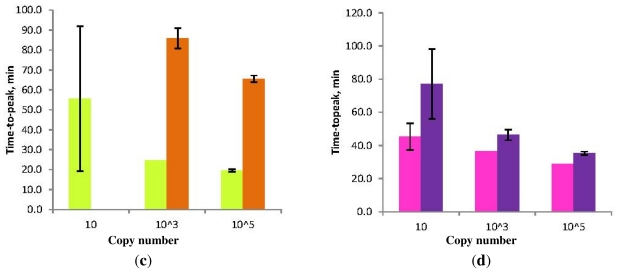
Figure 7.
Schematic diagram of the “forward” (conventional) and “reverse” orientation of Loop primers in LAMP-LOOP (a); Stem primers in STEM-LAMP (b) and comparison of LAMP-LOOP with Loop primers in conventional (lime) and reverse (orange) orientation (c) and STEM-LAMP with Stem primers in conventional (pink) and reverse (purple) orientation (d) for 10, 1000 and 100,000 copies of inlA-AT construct (all dilutions were measured and detected in triplicate unless indicated otherwise). Final primers concentrations were: Lm-BIP, Lm-FIP, Lm-StemB, Lm-StemF, Lm-LoopB, Lm-LoopF, rLm-StemB, rLm-StemF, rLm-LoopB, rLm-LoopF, Lm-DisplB and Lm-DisplF—0.8 μM each. Each set of data included three NTCs that remained clean throughout the duration of the assay and were not associated with any time-to-peak value (hence not shown graphically). Error bars represent standard deviations of triplicate measurements.


