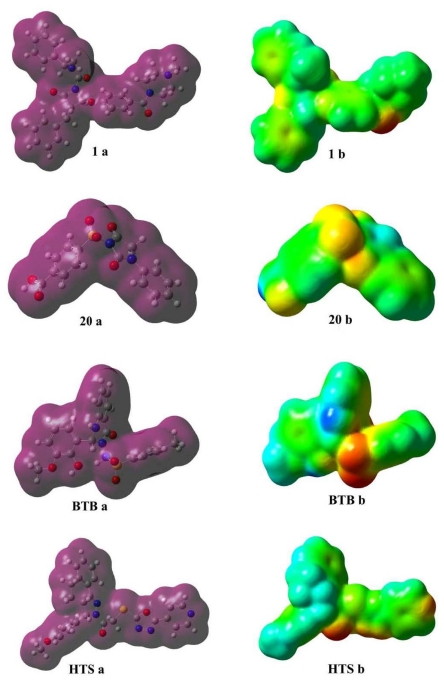
Figure 12.
Differential maps of total density (a) and MESP (b) of most active, 1, and least active, 20, compounds along with potent hits BTB (BTB02076) and HTS (HTS12673). The red and the blue color represent the electronegative and electropositive potentials whereas the green represents a potential halfway between the two extremes.

