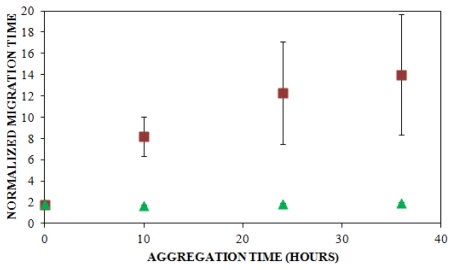
Figure 6.
Coaggregation of FITC-labeled insulin and unlabeled insulin. Insulin solutions consisting of 25% FITC-labeled insulin and 75% unlabeled insulin with LIF detection (
 , n = 6) and UV detection (
 , n = 3) were prepared at a concentration of 0.2 mg/mL in 40 mM Tris (pH 8.0) containing 150 mM NaCl. Solutions were subjected to agitation (185 rpm), and the formation of aggregates was monitored. LIF-CE was performed with a sample injection at 12 kV for 12 s with 15 kV separation and UV-CE was performed with a sample injection at 10 kV for 12 s with 15 kV separation. Both separations were performed using 1% PHEA separation matrix in PHEA coated capillary. Migration times were normalized as described in Figure 2. Error bars represent SE, n = 3–6. Some error bars lie within symbols. For all time points >0 h, UV data was statistically different from the LIF data with a p < 0.015.

