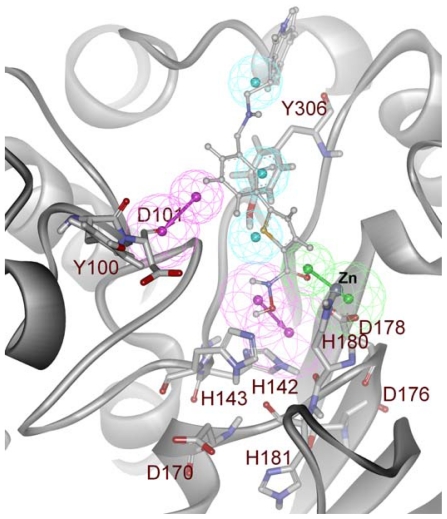
Figure 7.
Structure-based pharmacophore model generated from the HDAC8-C1 complex. Secondary structure of protein is shown in cartoon and amino acid residues are shown in stick form. The C1 inhibitor is shown in ball-stick representation. The identified pharmacophoric features are shown in green, cyan and magenta for HA, HY and HD features, respectively.

