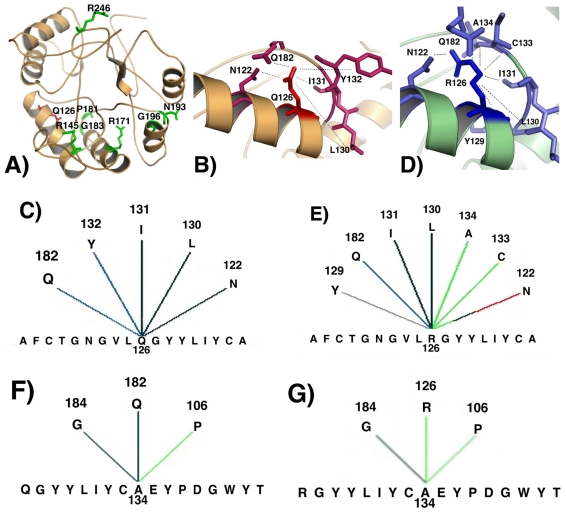
Figure 2.
(A) Modeled structure for the wild-type human 5α-reductase type II enzyme: Q126 native residue is denoted in red, and NADPH-binding site residues are illustrated in green; (B) Part of the modeled SRD5A2 structure showing internal contacts for Q126 native residue; (C) Graphical representation for internal contacts of Q126 residue; (D) Part of the modeled SRD5A2 structure showing internal contacts for R126 mutant residue; (E) Graphical representation for internal contacts of R126 residue: interactions with different residues (A134, C133) are created, one interaction is suppressed (Y132) and two different interactions are established with N122 residue; (F) Graphical representation for internal contacts for A134 residue in the native protein: interactions with G184, Q182 and P106 are observed; (G) Graphical representation of internal contacts for A134 residue in the mutant protein: the novel interaction with R126 is observed; (H) Graphical representation of internal contacts for Q182 residue in the native protein; (I) Graphical representation of internal contacts for Q182 residue in the mutant protein: A134 interaction is abolished and a new contact with I180 is observed. Colored lines represent different types of interactions: black = main chain–main chain hydrogen bond; blue = side chain–main chain hydrogen bond; red = side chain–side chain hydrogen bond; gray = aromatic stacking; green = hydrophobic interaction.


