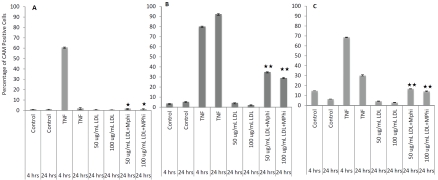
Figure 7.
Expression of endothelial adhesion molecules induced by native LDL with or without co-culture with monocytes (MPhi). Panel A shows results for E-selectin, Panel B for ICAM-1, and Panel C for VCAM-1. P value indicates the comparison of cultures with 50 or 100 μg/mL LDL only vs. 50 or 100 μg/mL LDL with monocyte cultures. * indicates p<0.05; ** indicates p<0.001, t-test.

