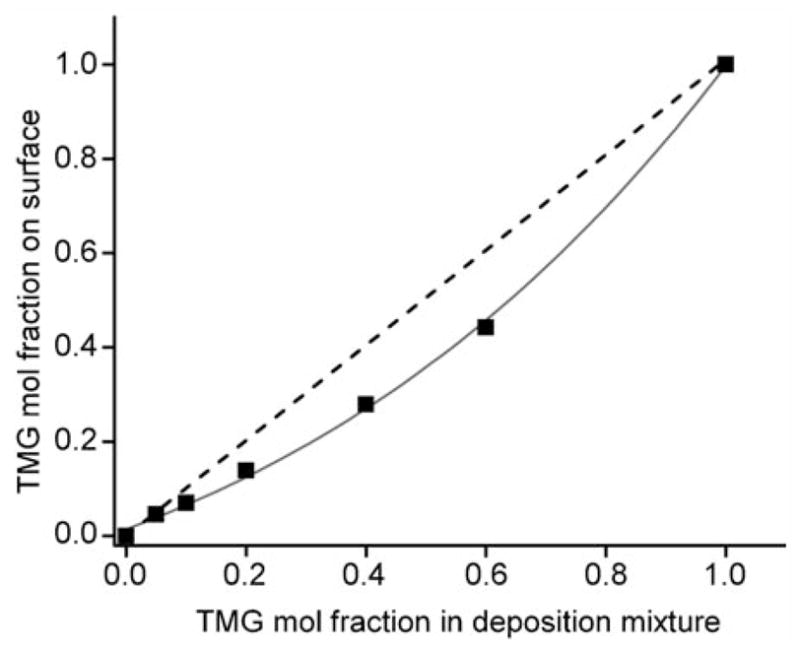
Figure 1.

Correlation between TMG-EG10 mole fraction in the deposition mixture and the fraction in the resulting organic monolayers as derived from the ratio of integrated areas of deconvoluted C1s signals for etheric and alkyl/alkynyl carbon atoms. Dashed line represents equal molar fractions in the deposition mixture. Solid line connects the data points measured on the resulting films, showing the preferential binding of the smaller alkene EG7 over the larger alkene TMG-EG10 on the silicon surfaces.
