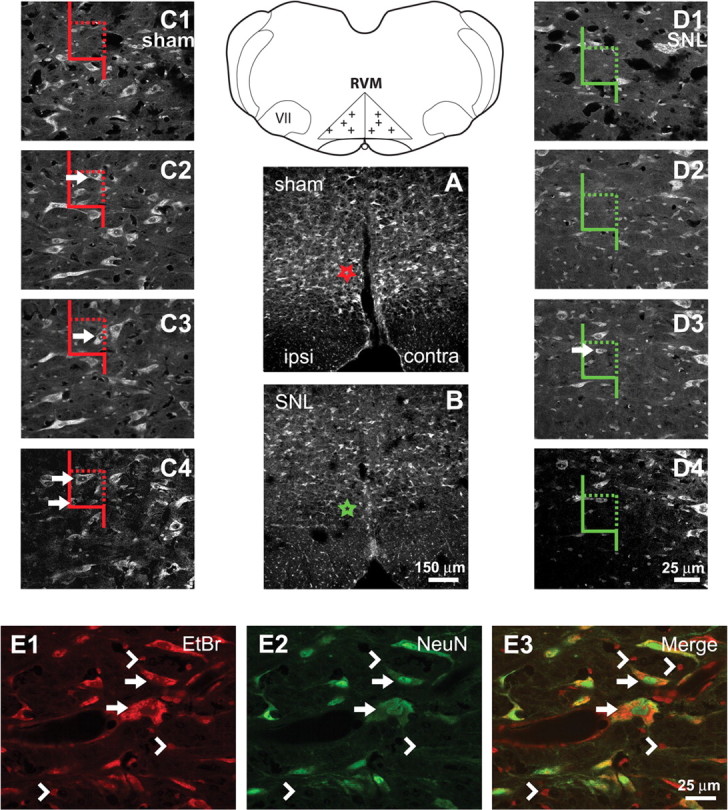
Figure 1.

Definition of RVM and description of cell-counting methods. Line diagram: The RVM was defined as an isosceles triangle, the base of which was the width of the pyramidal tracts. The height of the triangle on the midline was half the width of the base. VII, facial nucleus. Crosses mark examples of randomly selected points used for cell counting. A, B, Nissl-stained sections from sham-treated and SNL-treated rats, respectively. Fewer RVM neurons were observed in rats after SNL. Stars in A and B represent the locations of the counting frames in C and D, respectively. C, D, Examples of high-magnification sequences of images through the thickness of tissue sections used for cell counting. Color of counting frames corresponds to the color of the stars in A and B. Arrows indicate neurons that would be counted. A neuron might appear in multiple images through the thickness of a section but was only counted when its nucleolus was first observed. Neurons were counted if their nucleoli fell entirely within the counting frame, or if they were partially within the counting frame without being in contact with a rejection line (solid line). E1–E3, Comparison of Nissl and NeuN labeling. Arrows indicate Nissl-stained neurons that were also NeuN-IR. Arrowheads indicate Nissl-stained glia that were not NeuN-IR. Cells with dark cytoplasm, a vacuous nucleus and a dark nucleolus (the Nissl criteria we used for a neuron) were always labeled for NeuN. Scale bar in B applies to A and B. Scale bar in D4 applies to C1–C4 and D1–D4. Scale bar in E3 applies to E1–E3.
