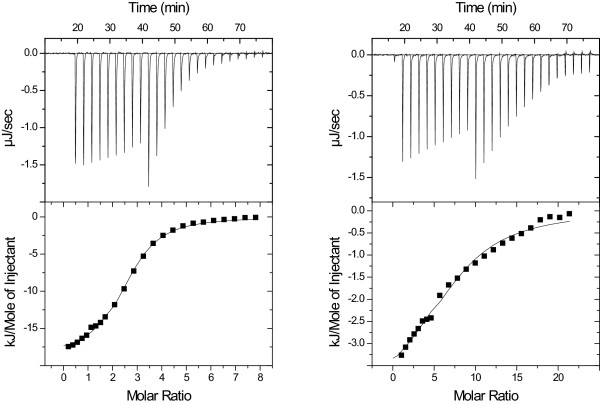
Figure 2.
Isothermal titration calorimetry experiments. Upper panels: Isothermal titration calorimetry raw data and binding curve of cellobiohydrolase I (TrCel7A) with nine 1-μl injections of xylan oligosaccharide (XOS), followed by fifteen 2-μl injections of XOS. Lower panels: Integrated peak areas (squares) and the best fit of the model. All binding experiments were conducted at 30°C. Left: A 1:1 mixture of xylooctaose (xyl)8 and xylononaose (xyl)9 was injected into TrCel7A. Right: The high XOS mixture was injected into TrCel7A.

