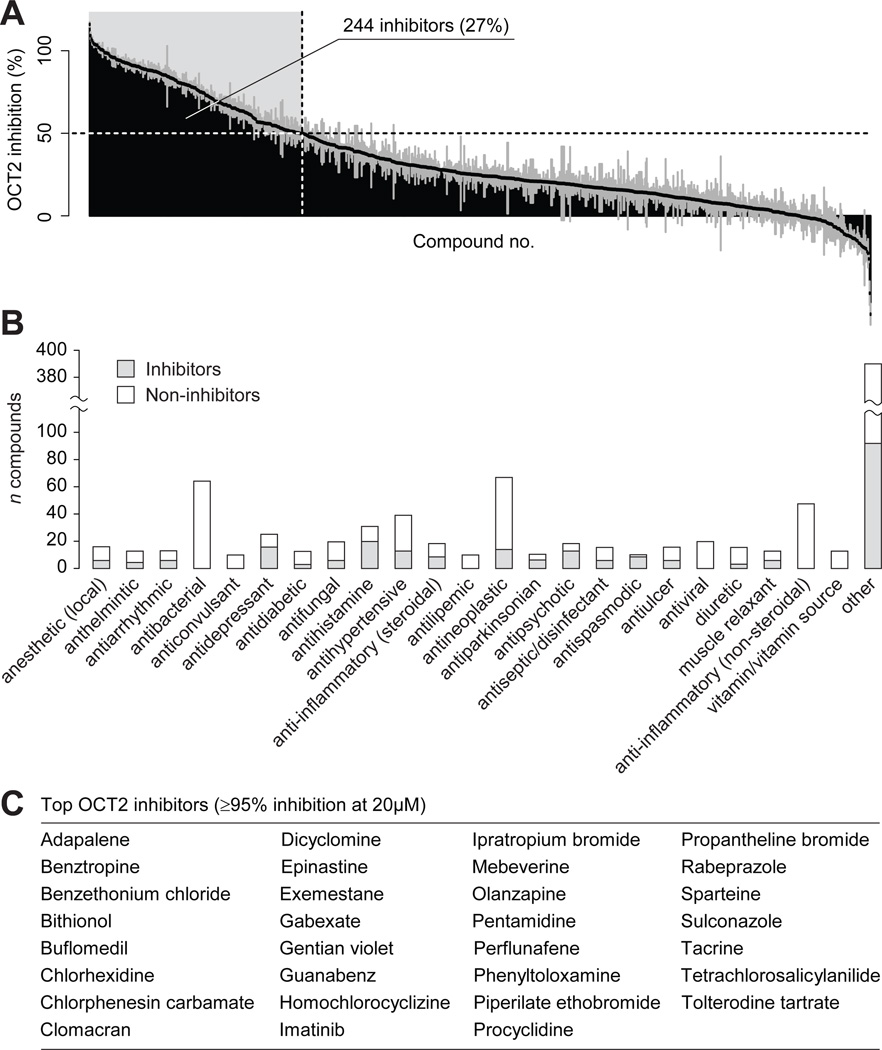
Figure 3. Inhibitors of OCT2 identified in a screen of 910 prescription drugs and drug-like compounds.
(A) Overview of the results from the screening of OCT2 inhibition. Each bar represents one compound. 244 compounds resulting in at least 50% decreased uptake of ASP+ were classified as inhibitors (shaded in light gray). Data are presented as mean ± s.d. (samples in triplicate from one experiment). (B) Therapeutic classes of the screened compounds. Therapeutic classes with ≥ 10 members in the screening library are shown as individual bars; all other classes were combined (“other”). Shaded and white bars represent the number of OCT2 inhibitors and non-inhibitors in each class, respectively. (C) High-potency OCT2 inhibitors resulting in ≥ 95% inhibition at 20 µM, corresponding to estimated IC50 ≤ 1µM.

