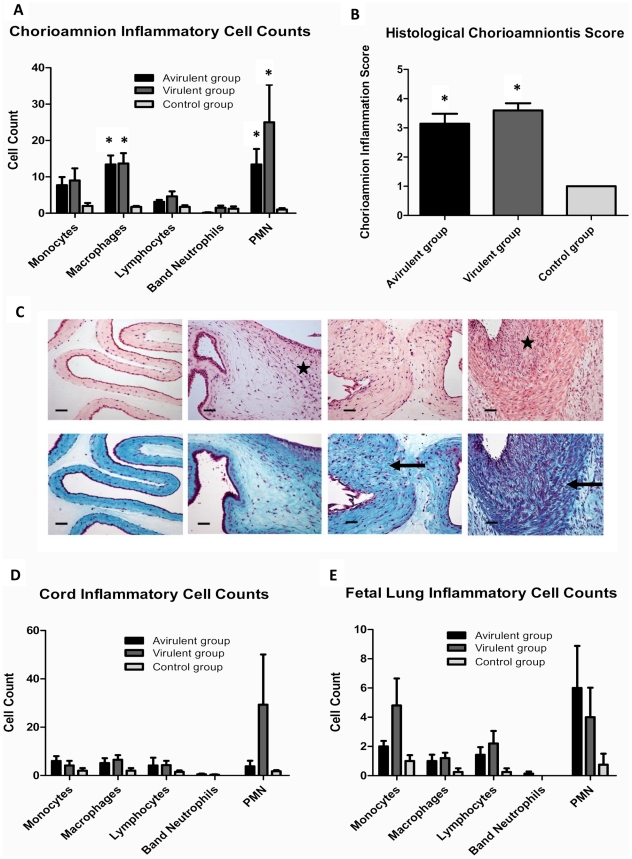
Figure 2. Fetal inflammation induced by intra-amniotic ureaplasma infection.
Inflammatory cell infiltrates within chorioamnion tissue (A) and the severity of histological chorioamnionitis (B) were increased in animals from the virulent and avirulent groups when compared to the control group. Representative chorioamnion sections ((C) stained with haematoxylin and eosin (top row) or Masson's trichrome stain (bottom row), photographed at ×200 total magnification) demonstrate the 4 stages of histological chorioamnionitis. From left to right: Grade 1 (uninfected control), minimal inflammatory cell infiltrate and no tissue fibrosis, necrosis or abscesses; Grade 2, mild inflammatory cell infiltrate and mild tissue fibrosis, necrosis or abscesses; Grade 3, heavy inflammatory cell infiltrate and moderate tissue fibrosis, necrosis or abscesses; Grade 4, heavy inflammatory cell infiltrate and sever fibrosis, necrosis or abscesses. Stars on haematoxylin and eosin stained sections indicate localized inflammatory cell influx. Arrows on Masson's trichrome stained sections represent tissue fibrosis and disruption of normal tissue morphology. Size bars represent 50 µm. Inflammatory cell infiltrates within cord tissue (D) and fetal lung tissue (E) were not statistically different between treatment groups. Data are presented as mean + SEM. * p<0.05 when compared to the control group.

