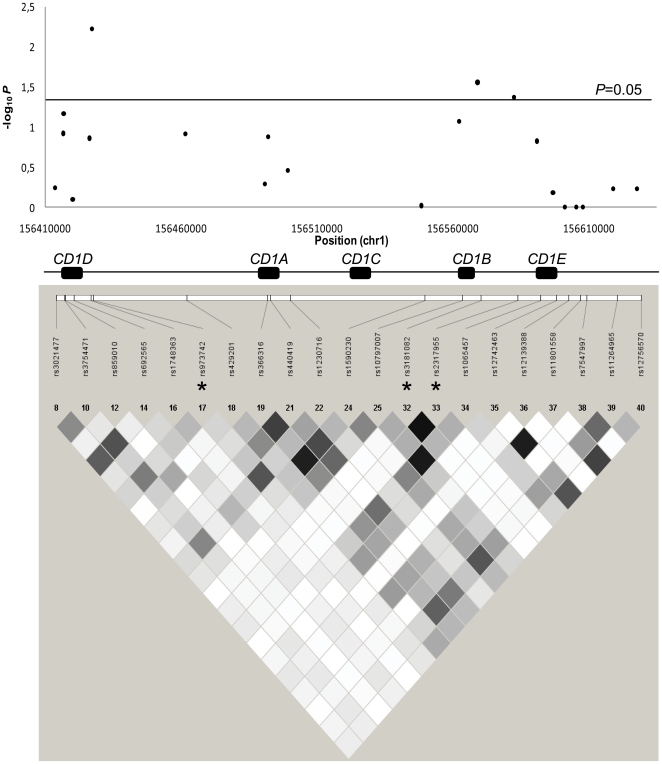
Figure 1. Tagging of the CD1 locus.
A) Allelic association results of the tag SNPs genotyped in CCALD and AMN patients: each black dot represents a tag SNP; -log10 P is plotted for each of the 21 tag SNPs; the five CD1 genes are indicated by black boxes; B) LD between the corresponding tag SNPs: LD is represented by shades of grey as a function of r2 values (black diamond for r2≥0.90, white diamond for r2 = 0). Associated tag SNPs are marked with an asterisk.

