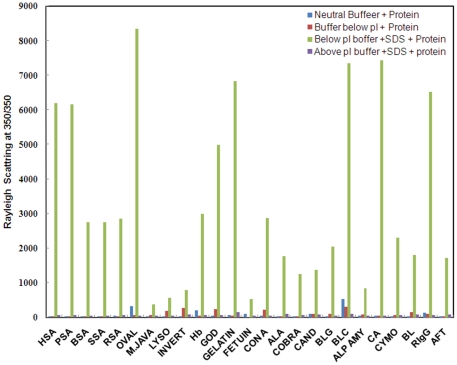
Figure 1. Rayleigh scattering measurements at 350 nm in the absence as well as presence of SDS at pH below and above two units of respective pI.
Data at neutral pH+protein [dark blue], pH below pI+protein [red], pH below pI+SDS+protein [light green], pH above pI+SDS+protein [purple]. The molar ratio of protein to SDS was 1∶100.

