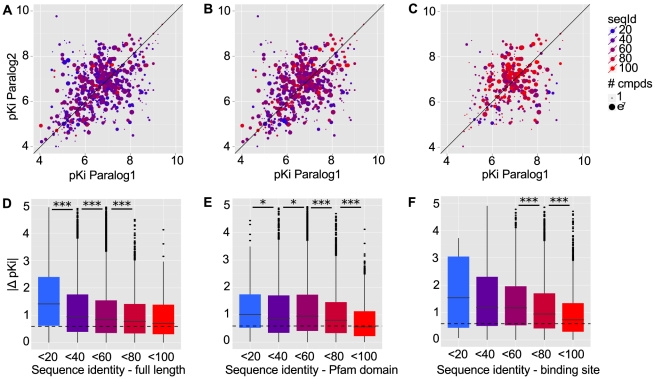
Figure 3. Differences in small molecule binding for human paralogs.
Sequence identity was measured on three levels: (a,d) Full sequence, (b,e) sequence of the domain containing the binding site and (c,f) residues of GPCR and kinase binding sites. Scatter plots of binding affinities measured against pairs of human paralogs are shown in the top row. Points represent median affinities of all compounds measured against a given combination of targets. Box plots in the bottom row represent the distribution of measured differences in binding affinity for pairs of targets having 0–20%, 20–40%, 40–60%, 60–80% and 80–100% identity. The level of significance of differences between bins are indicated with one ( ), two (
 ) or three asterisks (
 ). The dashed horizontal line indicates the mean inter-assay difference for human targets.

