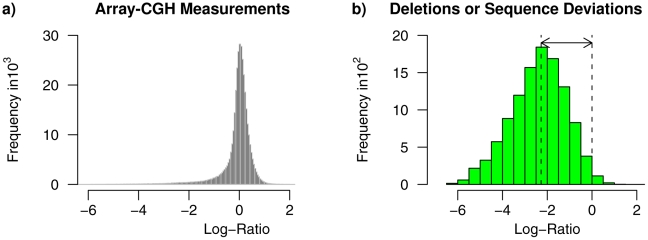
Figure 2. Characteristics of the Arabidopsis thaliana Array-CGH data set.
a) Distribution of log-ratios measured for genomic regions in the Array-CGH data set by [103] comparing the genomes of the Arabidopsis thaliana accessions C24 and Col-0. The log-ratio of a genomic region characterizes changes in copy numbers (deletions or amplifications) or sequence deviations of this region in C24 in comparison to Col-0. Unchanged genomic regions between C24 and Col-0 have log-ratios close to zero. Deletions or sequence deviations of genomic regions in C24 have log-ratios much smaller than zero. Amplifications of genomic regions in C24 have log-ratios much greater than zero. b) Distribution of log-ratios of genomic regions (tiles) in the Array-CGH data set covered to at least 75% ( 45 bp of 60 bp) by candidate regions of deletions or sequence deviations identified in [101] based on Affymetrix array-based resequencing data [100]. The large proportion of highly negative log-ratios indicates that these candidate regions are also present in the Array-CGH data set. Tiles covered by such candidate regions provide a useful resource for evaluating the identification of deletions or sequence deviations in the Array-CGH data set by different methods.

