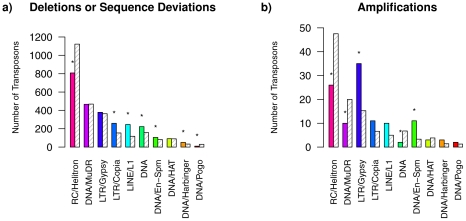
Figure 8. Superfamily classification of transposons in the Arabidopsis Array-CGH data set.
Superfamily classification of the 2,695 transposons identified to be affected by deletions or sequence deviations (a)) and of the 114 transposons identified to be affected by amplifications (b)) under consideration of the TAIR8 transposon annotation. Colored bars show the numbers of affected transposons in each superfamily identified using the state-posterior decoding of the parsimonious fourth-order HMM with underlying state-context tree structure in Figure 5. Grey dashed bars represent the mean number of transposons assigned to these superfamilies for sampling 500 times 2,695 transposons (or 114 transposons) from the total number of transposons of the TAIR8 annotation. Superfamilies highlighted by an asterisk ‘*’ are significantly different (over- or under-represented) with p-values less than 0.01 in comparison to random sampling.

