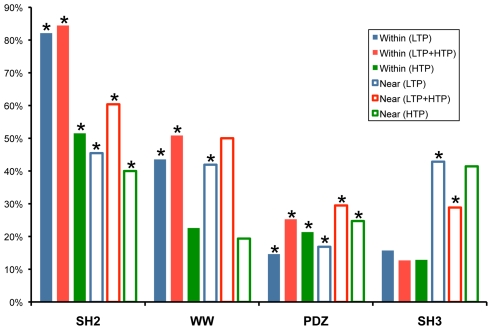
Figure 1. Coupling between phosphorylation events and domain-binding motifs.
For each domain family (SH2, WW, PDZ and SH3), the bars denote the percent of motifs found to be phosphorylated either within or near them. Solid-colored and empty rectangular bars represent intra-motif phosphorylation and near-motif phosphorylation, respectively. All motifs are derived from the high reliability dataset, while phosphorylation events are derived from three data sets: LTP (low throughput evidence only), HTP (phosphorylation events based on evidence from high-throughput resources), and LTP+HTP (any type of evidence). Asterisks represent statistically-significant results (Methods, Table 1 and Table S1).

