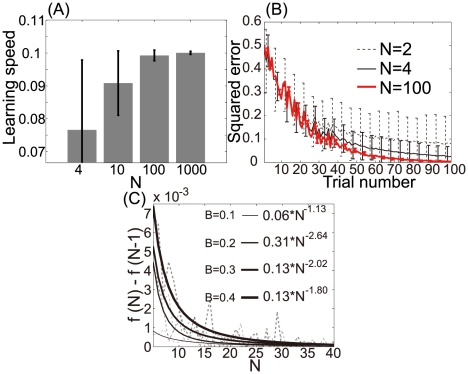
Figure 2. Relationship between learning speed and neuronal redundancy ( ).
).
(A): Learning speed when  , or
, or  . The bar graph and error bars depict sample means and standard deviations, both of which are calculated using the results of randomly sampled sets of 1000
  values. (B): Learning curves when
  , or
, or  . These curves and error bars show averaged values and standard deviations of errors. (C): Relationship between learning speed and the number of model neurons when
  , or
, or  . The horizontal axis represents the number of neurons
  and the vertical axis represents
  , where
  is the learning speed when the number of neurons is
  . Dotted and solid lines denote the average learning speed and power functions fitted to the values, respectively.

