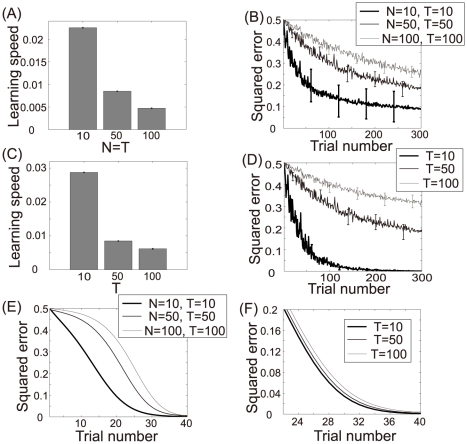
Figure 5. Importance of neuronal redundancy ( ).
).
(A): Learning speed when  ,
,  , or
, or  , where N and T are the number of neurons and constrained tasks, respectively. The bar graphs and error bars depict the sample means and standard deviations, both of which are calculated using the results of 1000 sets of
  values. (B): Learning curves when
  ,
,  , or
, or  . These curves and error bars show the average values and the standard deviations of the errors. (C): Learning speed when
  , or
, or  , and
, and  . The bar graphs and error bars depict the sample means and the standard deviations, both of which are calculated using the results of 1000 sets of
  values. (D): Learning curves when
  , and
, and  . These curves and error bars show the average values and the standard deviations of the errors. (E): Learning curves calculated when
  ,
,  , or
, or  and decoder
  is adaptable. (F): Learning curves calculated when
  , or
, or  ;
;  ; and the decoder
  is adaptable.

