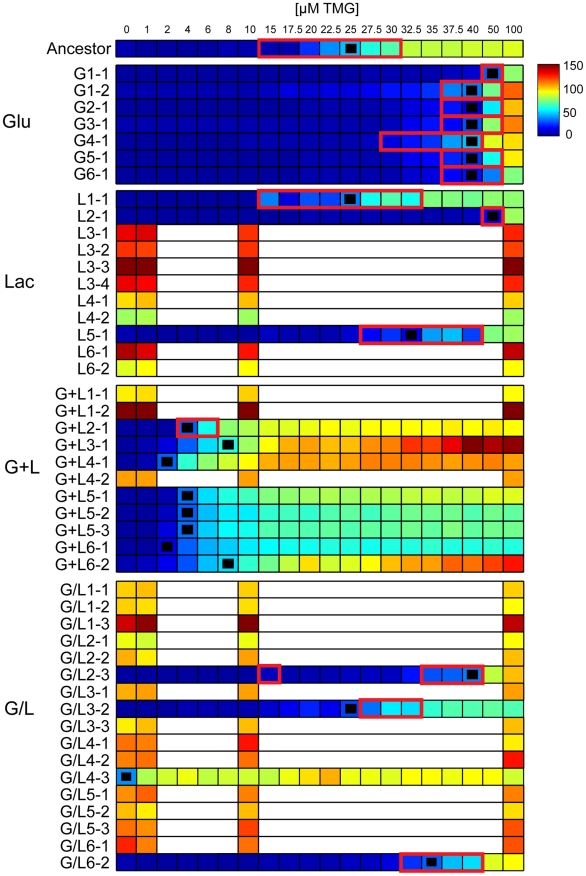
Figure 2. Inducer response profiles of evolved clones.
Heat maps show the mean response of the Plac-GFP reporter (RFU) for evolved clones at different concentrations of inducer (TMG). Black squares indicate the concentration of TMG that gave half maximal expression (TMG½Max) and red outlines indicate the presence of bimodal expression within the population. Inducer responses for clones with constitutive lac operons were only generated with four TMG concentrations because lac expression was independent of inducer concentration such that finer resolution measurements were redundant.

