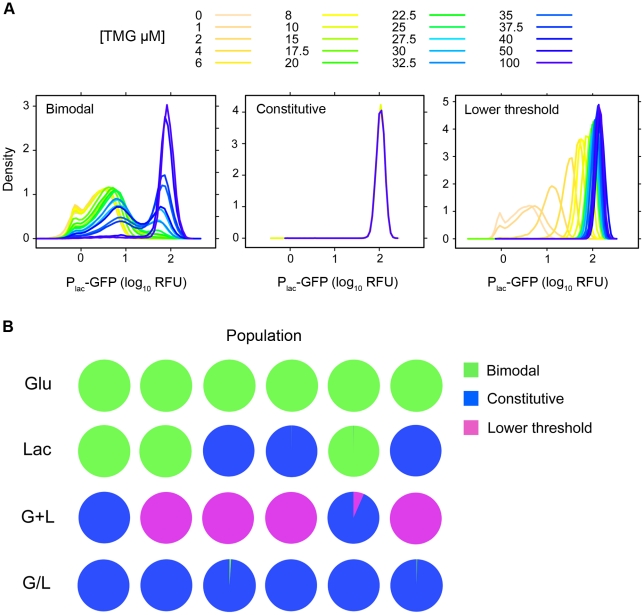
Figure 3. Inducer response classes and association with evolution environment.
A) Inducer response classes for evolved clones. 1) Bimodal with a higher threshold for lac induction, 2) Constitutive with expression levels that are independent of inducer, 3) Lower threshold for lac induction with graded response to inducer. Inducer response histograms are shown for clones representative of each class (Bimodal, L5-1; Constitutive, G/L5-1; Lower threshold, G+L3-1). B) Distribution of inducer response types by population and evolution environment. Pie charts show the fraction of clones with each inducer response type (Bimodal, Constitutive, Lower threshold) within a given population.

