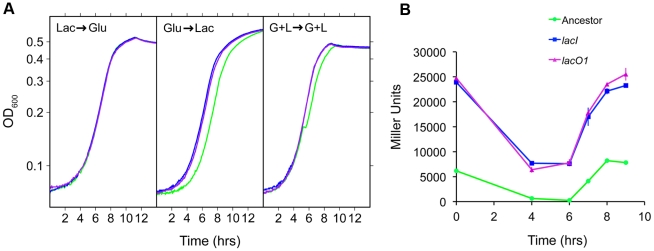
Figure 8. Physiological characterization of lac mutants.
A) Growth curves for the ancestor (green), and reconstructed lacI (blue) and lacO1 (purple) mutants. Conditions used were: Lac→Glu, Glu→Lac and G+L→G+L, where the sugars indicate pre-conditioning and measurement environments, respectively. These transitions correspond to those present in the G/L and G+L evolution environments. OD values are plotted on a log10 scaled axis. B) LacZ expression time course for the ancestor and the ancestor with lacI and lacO1 mutations during growth in the G+L evolution environment. Values are the average of two independent replicates with standard deviation shown.

