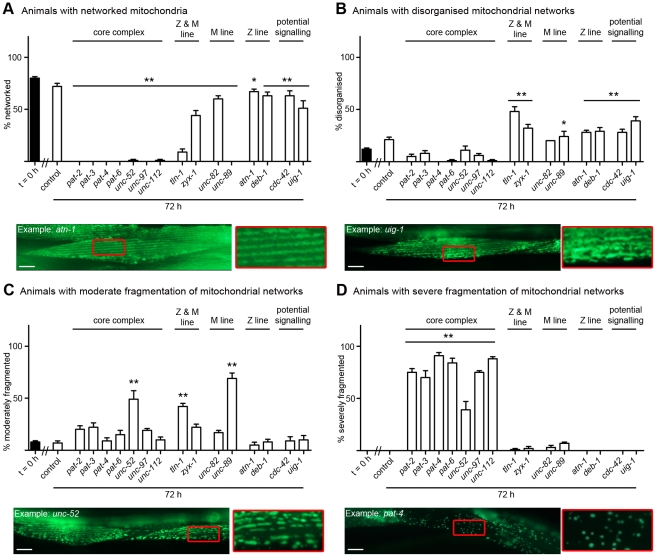
Figure 4. Loss of muscle attachment results in mitochondrial fragmentation.
Animals expressing GFP-tagged mitochondria were age synchronised at L1 stage and grown to young adulthood at 16°C (t = 0 h). Animals were then transferred to NGM RNAi plates [87] seeded with bacteria expressing dsRNA against genes indicated for an additional 72 h (mid-adulthood) at 20°C. The 20 most Unc animals were picked and scored for identical defects in mitochondrial structure in at least two muscles within the animal and this was repeated for 5 independent RNAi treatments (n = 100 animals per condition/time point). A) Percentage of animals where only networked mitochondria were observed is displayed as average ± SEM. Below the graph is an example of an RNAi treated animal displaying networked mitochondria (as indicated by the largely continuous parallel lines of GFP), these are enlarged 300% to the right of the micrograph and look arrayed like the sarcomeres (compare to enlargement in Figure 3A). B) Percentage of animals where disorganisation of the mitochondrial network was observed is displayed as average ± SEM. Below the graph is an example of an RNAi treated animal displaying disorganisation of the mitochondrial network (as indicated by the lack of parallel lines of GFP), these are enlarged 300% to the right of the micrograph. C) Percentage of animals where moderate fragmentation (>30%) of the mitochondrial network is observed is displayed as average ± SEM. Below the graph is an example of an RNAi treated animal displaying moderate fragmentation of the mitochondrial network (as indicated by the largely non-continuous parallel lines of GFP), these are enlarged 300% to the right of the micrograph. D) Percentage of animals where severe fragmentation (>90%) of the mitochondrial network is observed is displayed as average ± SEM. Below the graph is an example of an RNAi treated animal displaying severe fragmentation of the mitochondrial network (as indicated by sparse GFP puncta), these are enlarged 300% to the right of the micrograph. A sample image of an RNAi treatment against each gene can be found in Figure S2. *, **Significant difference from control t = 72 h, (P<0.01, P<0.001 two way repeated measures ANOVA). Scale bars represent 15 µm.

