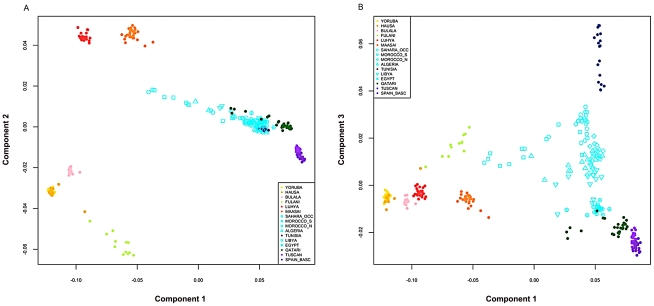
Figure 2. Multidimensional scaling components discriminating genetic clusters in Africa.
We used multidimensional scaling (MDS) to discriminate clusters of genetic variation within Africa and neighboring regions. MDS was applied to the pairwise, individual identity-by-state (IBS) matrix of 279,500 SNPs using PLINK 1.07 software [45]. The top three MDS components were plotted together using R 2.11.1. A) In axis one is plotted dimension 1 and in axis two is plotted dimension 2. B) In axis one is plotted dimension 1 and in axis two is plotted dimension 3. Population colors match Figure 1B (k = 8), with the exception that the Fulani group was highlighted as a distinct population, indicated in light green. North African populations are all indicated in turquoise except for Tunisians that are shown in dark blue.

