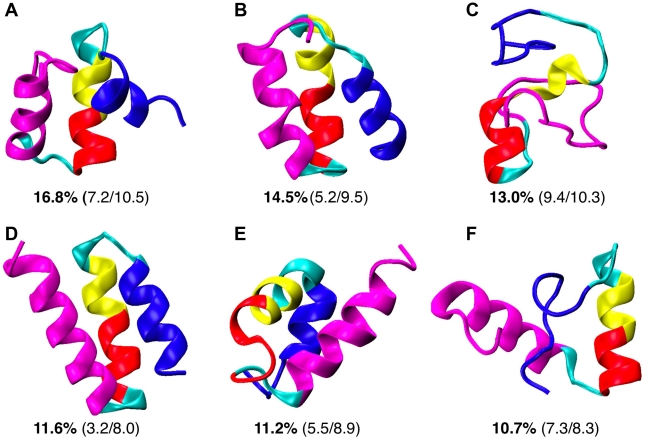
Figure 4. Averaged structures of the six most populated clusters of free NCBD.
These clusters are identified based on the conformations sampled at 305 K during the last 60 ns of the 100 ns REX control simulation. All structures were aligned by minimizing the backbone RMSD of Cα2 (the red segments) and visualized in the same view. The numbers below each structure are the population of the cluster and backbone RMSD values from the folded conformations in 1kbh and 1zoq (see Figure 1). The protein is colored in the same fashion as in Figure 1a–b.

