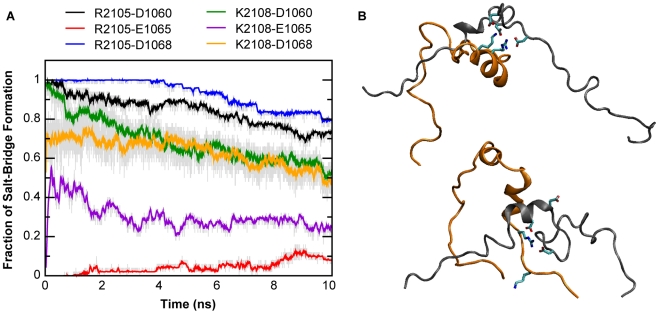
Figure 8. Native and non-native salt-bridges in the NCBD/ACTR interaction.
A. Evolutions of average probabilities of various salt-bridge interactions during unfolding simulations at 475 K. Arg and Glu/Asp residues were considered in contact if the carbonyl carbon and Arg CZ distance was no greater than 5 Å, and Lys and Glu/Asp residues were considered in contact if the side chain carbonyl carbon and amide nitrogen distance is no greater than 4 Å. B. Two representative final conformations after 10 ns simulations at 475 K. NCBD and ACTR are colored orange and gray, respectively. The side chains of key charged residues are also shown, including NCBD R2105 and K2108 and ACTR D1060, E1065, and D1068. The snapshot on the top represents a case where all six possible salt-bridges are formed, and the one at the bottom represents a case where only the native ones, between NCBD R2105 and ACTR D1068 and D1060, are formed.

