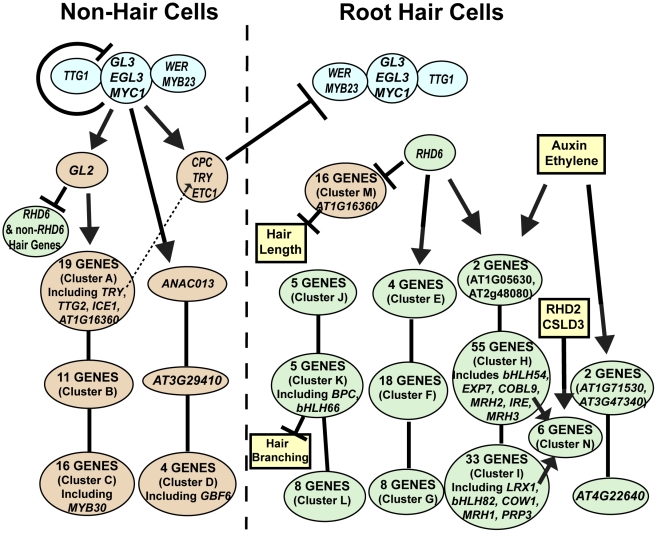
Figure 8. Model of the root epidermal gene network.
The predicted transcriptional relationships are shown for the 154 core root hair genes (green), the 54 core non-hair genes (orange), the early acting transcription factors (blue), and other factors not formally part of the network (yellow). The location of genes along the y axis of the figure indicates the relative timing of maximal gene expression during root epidermis development. Genes or gene clusters connected by lines without arrowheads represent genes at a common transcriptional regulatory position but differing in their temporal expression (Zones 1/2, 3/4, and 5/6, from top to bottom). The lists of specific genes in each cluster (A–N) are provided in Table S8, and the GO classes overrepresented in each cluster is given in Table S9.

