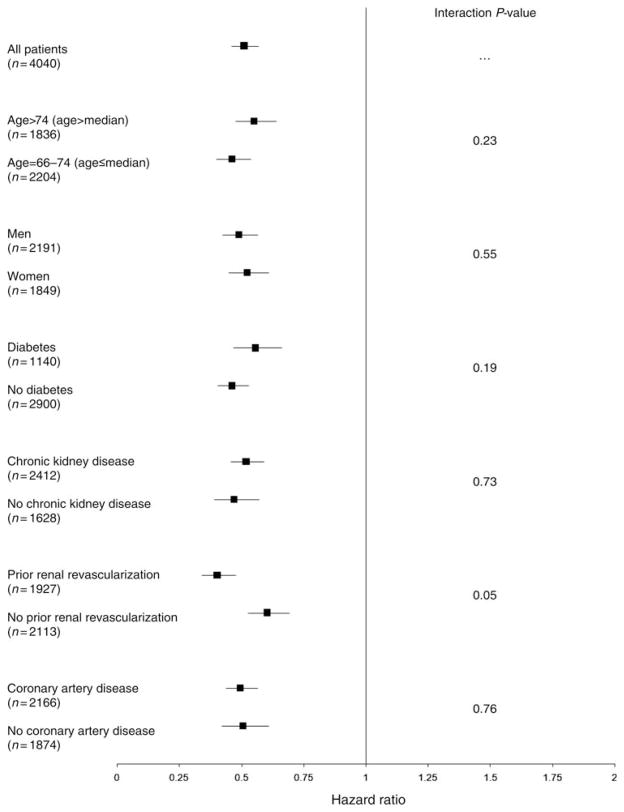
Figure 1.
Subgroup analyses for the primary outcome of major cardiorenal events. All analyses were adjusted for demographic characteristics, cardiovascular risk factors, comorbidities, measures of health-care utilization, screening, and medications. For each subgroup, the square represents the hazard ratio with horizontal lines representing the 95% confidence interval.

