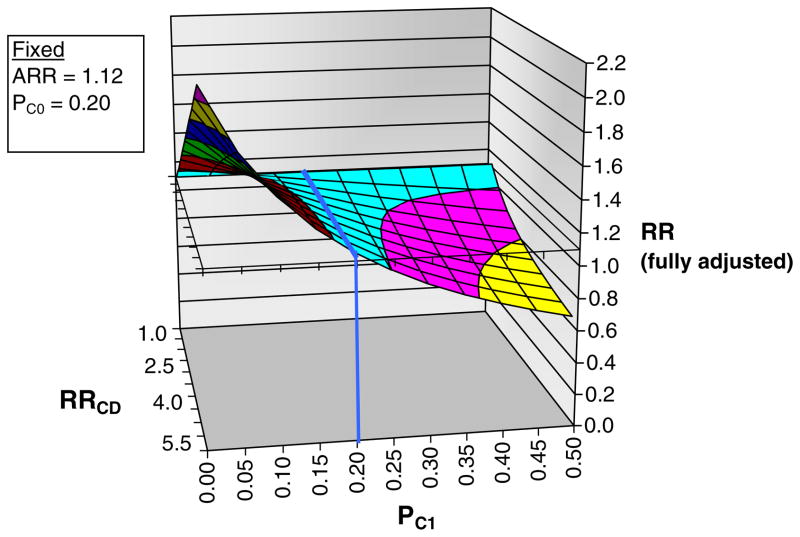
Fig. 3.
Sensitivity analysis of residual confounding using the array approach for our primary outcome (hospitalization for upper gastrointestinal bleed). To facilitate interpretation by the reader, we have maintained the notation used in the explanatory article and Excel program that we modified (available at www.drugepi.org) to produce this figure [29]. ARR apparent exposure relative risk, i.e., the relative risk (hazard ratio) observed in the current study (risedronate versus alendronate), fixed at 1.12. PC0 prevalence of counfounder among unexposed (alendronate), fixed at 20% in this example. PC1 prevalence of confounder among exposed (risedronate) group, varied from 0% to 50% in the figure. RRCD association between confounder and disease outcome, varied from 1.0 to 5.5 in figure. RR fully adjusted or “true” exposure relative risk. Blue line no confounding present, prevalence of confounder same among alendronate and risedronate recipients

