Figure 4.
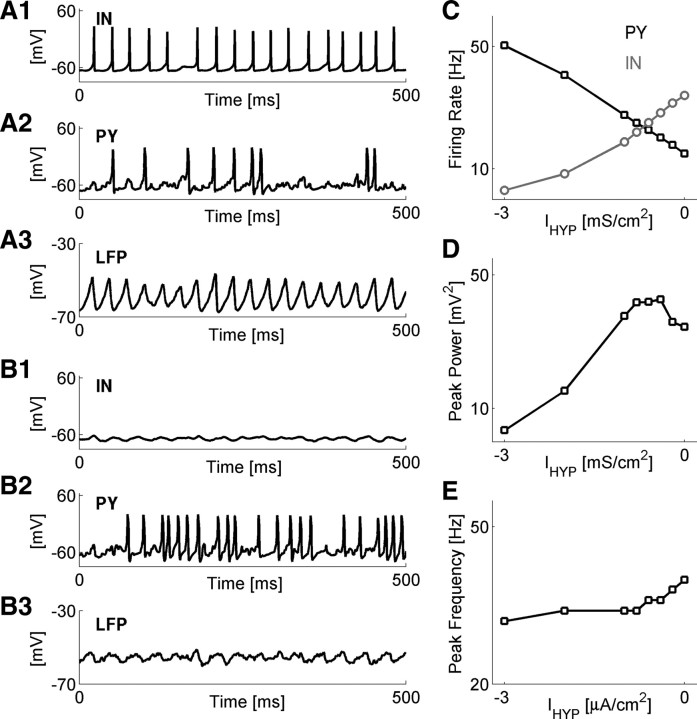
PV deficiency at GABA synapses prevents the disinhibition of network dynamics. A, Representative membrane potentials and LFPs obtained for scenarios of intact networks (F[PV] = 0 = 0), in which all model interneurons were subject to hyperpolarizing DC current IHYP. A1–A3, Membrane potential of sample interneuron (A1), membrane potential of sample pyramidal neuron (A2), and local field potential (A3) for the case IHYP = 0 μA/cm2. B, The same as in A, but for IHYP = 3 μA/cm2. C, Network-averaged firing rates of model PY (black squares) and IN (gray circles) neurons versus the magnitude of IHYP. Data points are averages ± SEM. D, Magnitude of spectral power peak versus the magnitude of IHYP. E, Location of spectral power peak versus the magnitude of IHYP.

