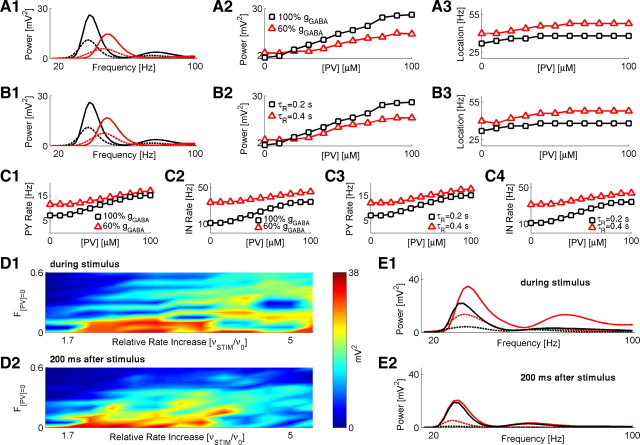
Figure 6.
Reduced GAD67 exacerbates the effect of parvalbumin deficit on network activity. A1, Spectral power plots for the scenario in which PV deficit is accompanied by reduced GABA conductance: gGABA at 100% of its baseline value and [PV] = 100 μm (solid black); gGABA at 100% of its baseline value and [PV] = 40 μm (dashed black); gGABA at 60% of its baseline value and [PV] = 100 μm (solid red); gGABA at 60% of its baseline value and [PV] = 40 μm (dashed red). A2, A3, Quantification of spectral peak power (A2) and frequency (A3) changes versus different PV concentrations and alterations in GABA conductance. Black squares, gGABA at 100% of its baseline value. Red triangles, gGABA at 60% of its baseline value. Network stimulation frequency was vSTIM = 250 Hz. B1, Spectral power plots for the scenario in which PV deficit is accompanied by slower time τR of GABA synapse recovery from depression: τR = 0.2 s and [PV] = 100 μm (solid black); τR = 0.2 s and [PV] = 40 μm (dashed black); τR = 0.4 s and [PV] = 100 μm (solid red); τR = 0.4 s and [PV] = 40 μm (dashed red). B2, B3, Quantification of spectral peak power (B2) and frequency (B3) changes versus different PV concentrations and altered time of GABA synapse recovery from depression. Black squares, τR = 0.2 s. Red triangles, τR = 0.4 s. Network stimulation frequency was vSTIM = 250 Hz. C1–C4, Firing rates of PY (C1, C3) and IN (C2, C4) model neurons for different scenarios shown in A and B. D1, Magnitude of spectral power peak (time average over stimulus duration) versus F[PV] = 0 and relative (to the baseline stimulation of v0 = 150 Hz) increase in stimulation rate. D2, Magnitude of spectral power peak (time average over 200 ms after stimulus) versus F[PV] = 0 and relative increase in stimulation rate. Color scale is the same for D1–D2. E1, Spectral power over the time duration of stimulus presentation (40 ms) for different scenarios: gGABA at 100% of its baseline value and F[PV] = 0 = 0 (solid black); gGABA at 100% of its baseline value and F[PV] = 0 = 0.4 (dashed black); gGABA at 60% of its baseline value and F[PV] = 0 (solid red); gGABA at 60% of its baseline value and F[PV] = 0 = 0.4 (dashed red). E2, Spectral power over 200 ms following stimulus cessation; keys are the same as in E1. In both E1 and E2, stimulus rate was vSTIM = 400 Hz.

